Video on Demand (VOD) is hot and with the recent launch of Apple TV+ and Disney+ in The Netherlands, VOD is more in the spotlight than ever. The Dutch television and video market is undergoing an enormous transformation, in which linear television seems to be losing a substantial share. The relationship between revenue from viewers via Subscription Video on Demand (SVOD) and Transaction Video on Demand (TVOD) on the one hand and revenue from advertisers via Spot/Non-Spot advertising and Advertising Video on Demand (AVOD) on the other hand is also beginning to show a visible shift in favour of viewer income. Peter Wiegman from Mediaonderzoek.nl and Berry Punt from Nielsen analysed the development of the economic size of the Dutch video market in the period 2014-2018 and concluded that the market is growing enormously and that a minute of ‘viewing’ by the consumer is increasingly profitable.
To get a good ‘picture’ of the revenues per minute of viewing, it is necessary to map viewing time and consumer and advertiser spend as accurately as possible. This requires different sources for both sides. Let us first concentrate on viewing time.
Viewing time
The viewing time still consists largely of linear viewing, supplemented by time shifted viewing, watching video/DVD/harddisk and streaming services. The viewing behaviour on a television set is largely mapped out by the Dutch viewer audience measurement service (Stichting Kijkonderzoek, SKO), which determines and measures the currency in the Dutch market on behalf of publishers, advertisers, and media agencies.
Until 2018, viewing behaviour on devices other than televisions was part of SKO’s activities. Another source is Media:Tijd, the biennial study commissioned by the joint audience measurement surveys, which maps out, among other things, video viewing on a device other than a television set. Via Media:Tijd it is also possible to calculate the viewing share of the television set compared to other devices for linear viewing, time shifted viewing, “streamed, downloaded or purchased content” and “Other”, including YouTube.
The sum of the SKO figures and the figures from Media:Time provides a very good insight into the viewing time to the TV screen and other devices (see table 1).
The total screen time has declined by 14 minutes in five years. This decrease is entirely due to the linear part, at least, on the television screen. On other devices, the viewing time increased linearly, although the number of two minutes in 2018 is negligible. In 2014, the linear share was still 81%, of which 67% remained in 2018. This is the part where publishers make money with the revenues from advertising. We can therefore add this part to Spot/Non-Spot/AVOD, i.e., the total video consumption funded by advertisers.
The counterparts of Spot/Non-Spot/AVOD are SVOD and TVOD, where the S stands for Subscription and T for Transaction. Netflix is a form of SVOD, Pathé Thuis is transaction based, and so is TVOD. Both forms are by definition funded by the viewer and not by the advertiser. However, there are known hybrid forms, such as a subscription to FOX Sport Eredivisie in which the subscriber is still presented with advertising. In 2020, Videoland will also experiment with a hybrid form, in which a lower subscription fee will be compensated by displaying commercials. Further on, more will be discussed about mixed forms and revenues.
If we count Spot/Non-Spot at AVOD on the one hand and merge TVOD and SVOD on the other, a division is visible, with the advertiser responsible for the first part and the viewer for the SVOD/TVOD part. The distribution of the viewing minutes to both forms is then as follows:
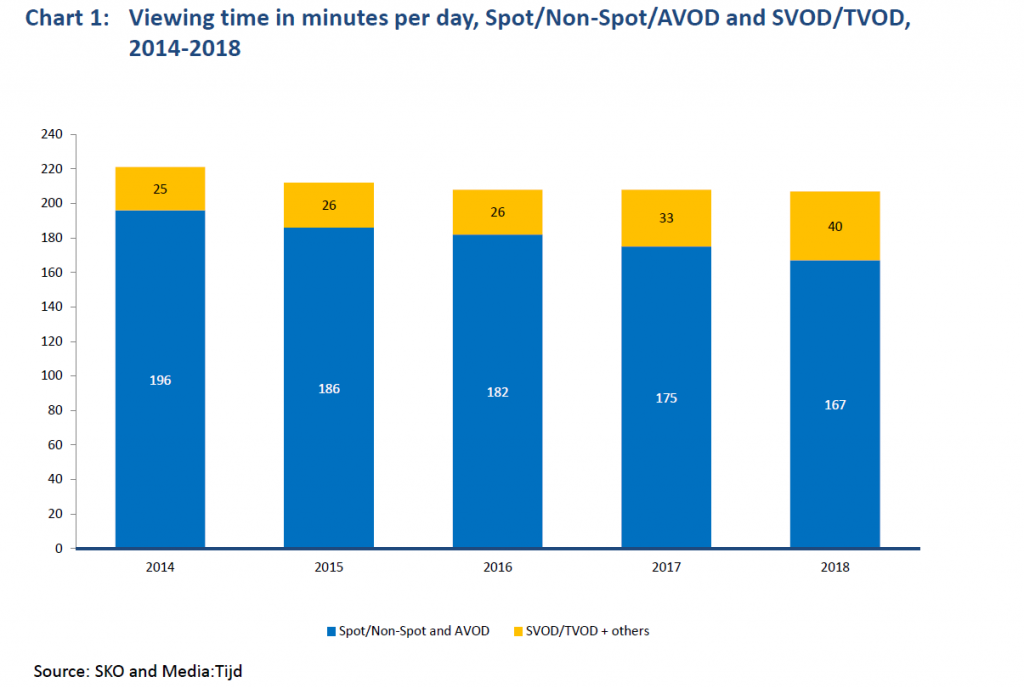
The vast majority of viewing time is still funded by the advertiser, but it is decreasing in volume and share. In 2014, Spot/Non-Spot AVOD still had a share of 89%; in 2018 this decreased to 81%.
Spending and income
To have a good view on the revenue per minute of viewing, the expenditure of both the viewer and the advertiser has been collected over the period from 2014-2018. Advertiser spend comes from Nielsen, the viewer spending is calculated on the basis of Telecompaper data in combination with public data such as subscription prices and information from the Netherlands Film Fund (Nederlands Filmfonds). Note that expenditure on standard TV packages and/or Triple Play packages is not included. These expenditures cannot be directly linked to a viewing minute.
Advertisers
Nielsen reports annually on net spending on TV advertising. Initially, this was ad spend on commercials broadcasted on television, but over the years, online video has also been added. These are the expenditures that advertisers make on commercials around television content, broadcasted on a different platform than television. Think of NPO Start (website / app from public broadcaster for (time shifted) viewing) or the websites of the TV broadcasters themselves.
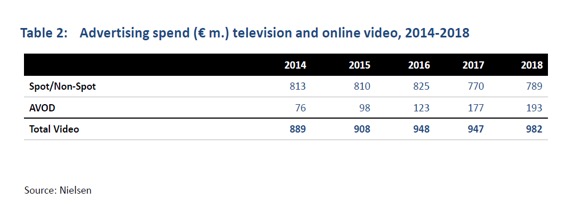
Expenditure on television advertising is on a downward trend, although in five years’ time it has fallen by only 3% and even increased again in 2018 (+2.5%). Online video (OLV) is growing strongly over the years. Mutual stocks are therefore subject to change. In 2014, the OLV share was still 9%, and five years later it has risen to 20%.
Viewers
With the launch of streaming services such as Netflix and Videoland, consumer spend seems to be a new phenomenon, but nothing could be further from the truth. As early as the 1980s, parties were already busy with pay-TV and decoders. FilmNet, later taken over by Canal+, was a good example of this. For a fixed monthly fee, relatively new films could be watched at regular intervals. At the time, FilmNet was the window between the cinema and television. On demand was not yet there and FilmNet got stuck on a base of about 200,000 subscriptions.
Today, a FilmNet looks very different. It is streamed via IP and can be shared on all kinds of devices and in different households. The offer is numerous and is not limited to films only. Series and documentaries are often part of the standard inventory and there are also plenty of originals.
To be able to calculate the revenue from SVOD, we used data from Telecompaper, which keeps track of the number of subscribers from streaming services on a quarterly basis. Per year we have calculated the average number of subscribers and multiplied it by the applicable subscription prices. To calculate the average number of subscribers, both regular and trial subscriptions have been included, because it is not possible to distinguish real and trial subscriptions between all the years and all the providers. In addition, standard prices have been used. The revenue as reported concerns Netflix, Videoland, NPO Start, Amazon Prime Video, NL Ziet and RTL XL. The turnover of the other (read: smaller) providers is too small. For TVOD, the figures come from the Netherlands Film Fund (Nederlands Filmfonds, Film Facts & Figures, May 2019).
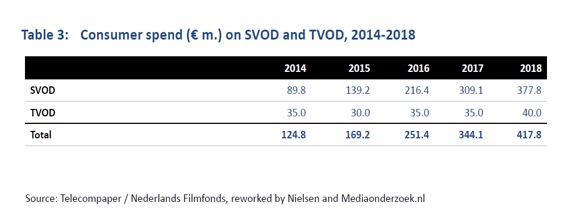
The revenue from SVOD is by far the largest in comparison with TVOD. Furthermore, TVOD is fairly constant over time, while SVOD has more than quadrupled in five years’ time. Consumers’ total expenditure on Video on Demand will amount to almost € 420 million in 2018. According to Statistics Netherlands (Centraal Bureau voor de Statistiek, CBS), there were 7.9 million households in that year. The VOD budget per household is therefore € 53 per year. In 2014, this was € 16 with 7.6 million households.
Revenue per minute
Adding up the consumer and advertiser spending results in a video market of around € 1.4 billion in 2018. This is an increase of almost 40% compared to 2014.
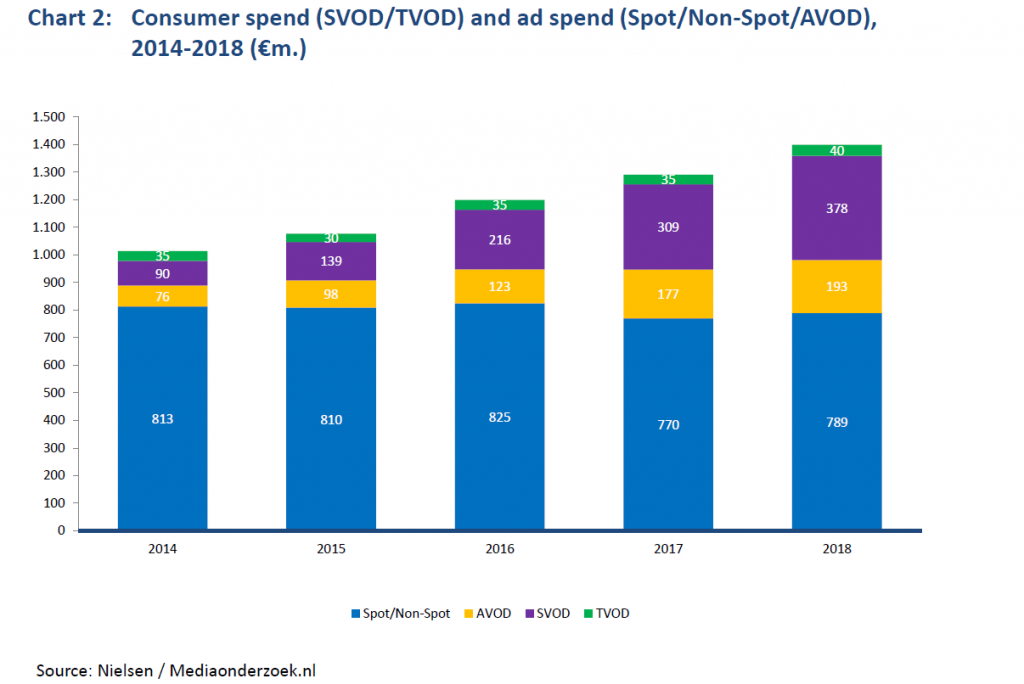
If the amounts in the chart above are divided by the viewing times as presented previously, an average revenue per viewing minute can be calculated. This is shown in the following graph:

In 2014, the revenues per minute of the viewer and the advertiser were still fairly close to each other. The advertisers spent € 4.5 million per minute, and the viewers were just above that with € 5 million. Five years later, the advertisers’ revenue per minute increased by more than 30% to € 5.9 million, but the viewers accounted for € 10.4 million. Compared to 2014, this is an increase of more than 200%. In 2018, with € 10.4 million, there is a stabilisation. It is unknown whether this will continue in 2019.
The total revenue per viewing minute is not an addition of Spot/Non-Spot and AVOD and SVOD/TVOD, but a weighted addition based on the corresponding viewing volume. This means that the total is closer to Spot/Non-Spot/AVOD, since that is also where the largest viewing volume is located.
Summary and conclusions
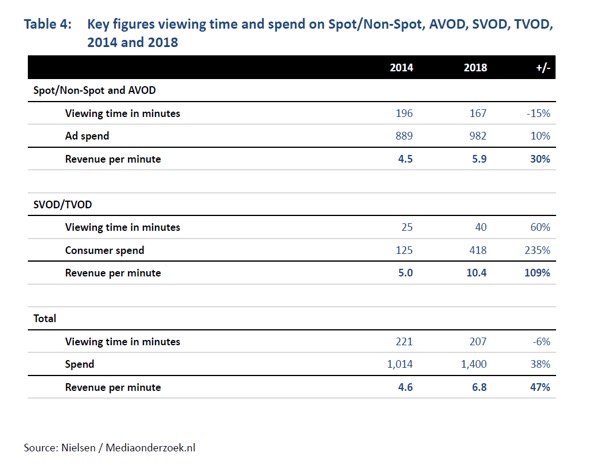
In this article, the viewing time and revenues from Spot/Non-Spot and AVOD on the one hand and TVOD/SVOD on the other hand have been compared to each other over the period 2014-2018. The key figures from the previous analysis are shown in the following table:

It is clear that the growth market is on the side of TVOD/SVOD, where consumer spend has increased from € 125 million to € 418 million in five years’ time. Combined with a 60% increase in viewing time, the revenue has more than doubled in 2018 per minute compared to 2014. The part that is funded by the advertisers’ decreases in viewing volume and yields ‘only’ 30% more per minute compared to 2014. This is of course also a sharp increase and, measured in size, still the largest source of income for broadcasters, although the growth in five years’ time was moderate and Spot/Non-Spot showed a slight downward trend.
Looking at the current shifting proportions, the viewer becomes more important as a source of revenue for video content. A similar trend has also been visible for years in the newspaper market, where subscriber revenues now account for 80% compared to 20% advertising turnover. At the turn of the century, this ratio was still 50/50.
A further optimisation of the revenues per minute could be a hybrid model, where viewers pay a lower subscription fee in exchange for advertising. Hulu recently experimented with this model and learned that only subscriptions led to revenue of $11 per viewer per month, but that a lower subscription fee ($5) plus advertising ultimately yielded $17 per viewer. Videoland is going to experiment with a similar model in 2020, so who knows, the proportions might change there as well. 2020 is also the year in which Disney+ and Apple TV+ for the first time will run for a whole year, so that the shifts outlined above are even more in motion. We’re going to ‘watch’ it. The analysis outlined above at least reflects the trend well and can be refined as more and better data become available in the future.
Context 1: Target groups and shares
The viewing volumes presented are based on the total target group of 6+ (SKO/Television) and 13+ (Media:Time/other devices). If the viewing times of television are divided by age, it can be seen that the viewing time of the young people in particular has declined in recent years. The index compared to 2014 is 53 in the target group of 13-19 year olds. This index increases with the age of the target group.
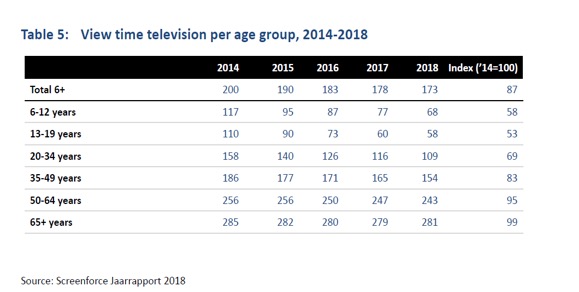
The target groups differ in size. To have a good picture of the shares per target group, the viewing time must be multiplied by the population size. This is what it looks for 2014 and 2018:
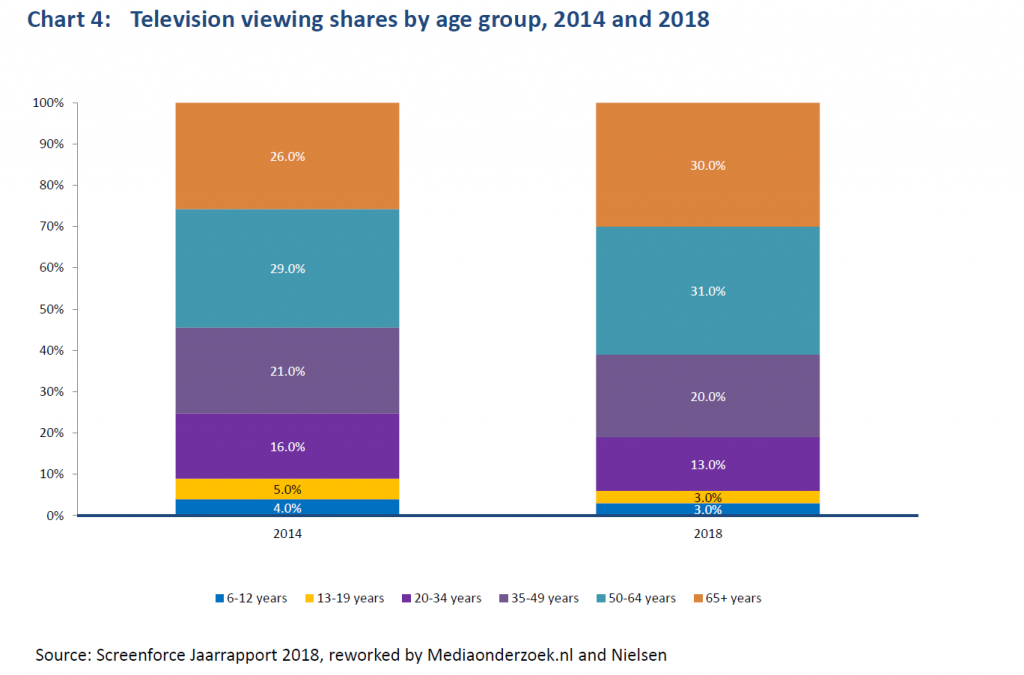
The shares have only increased in the target groups of 50-64 year old adults and those who are 65+ in the past 5 years. Together they account for 61% of the viewing volume in 2018 (compared to 56% in 2014). The remaining share is for target groups under 50 years of age and increased to 39% in 2018 (compared to 44% in 2014).
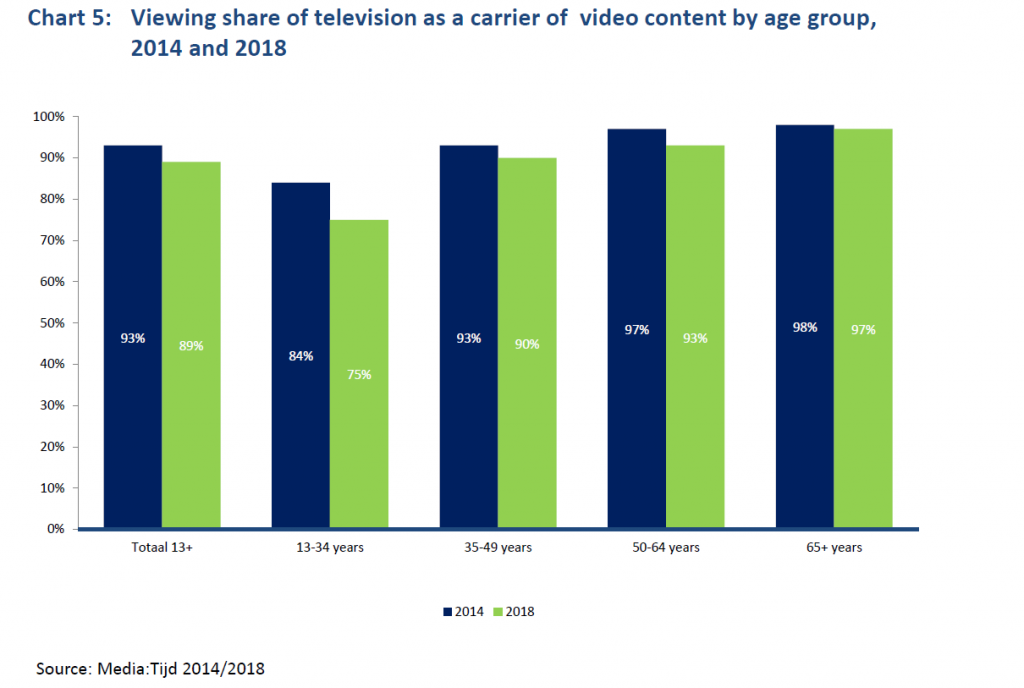
In the same period, according to Media:Tijd, the viewing share of television as a carrier of video images fell from 93% to 89%. There, too, differences can be seen per age group, with the largest decrease being seen in the 13-34 year old target group.
Context 2: Reception and devices
The growth of SVOD and TVOD thrives on the development of ever smarter TV screens and faster distribution of the signal. In 2014, only 22% of TV sets had access to the Internet; in 2018, this more than doubled to 47%. In the same period, ownership of a media centre such as Apple TV and/or Chromecast increased from 7% to 22%. The use of such devices for watching Netflix or YouTube on a TV screen, for example, is becoming less and less necessary as both TV screens and set-top boxes are increasingly equipped with such apps.
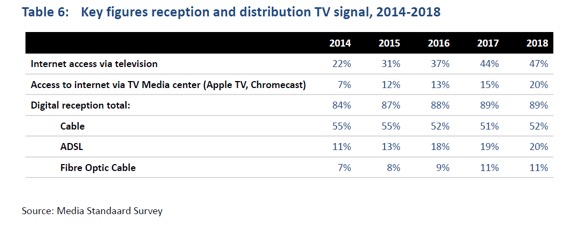
Streaming services depend on digital distribution. This is now at almost 90%, of which cable has the largest share. ADSL and fibre optic cables follow at a distance.

